
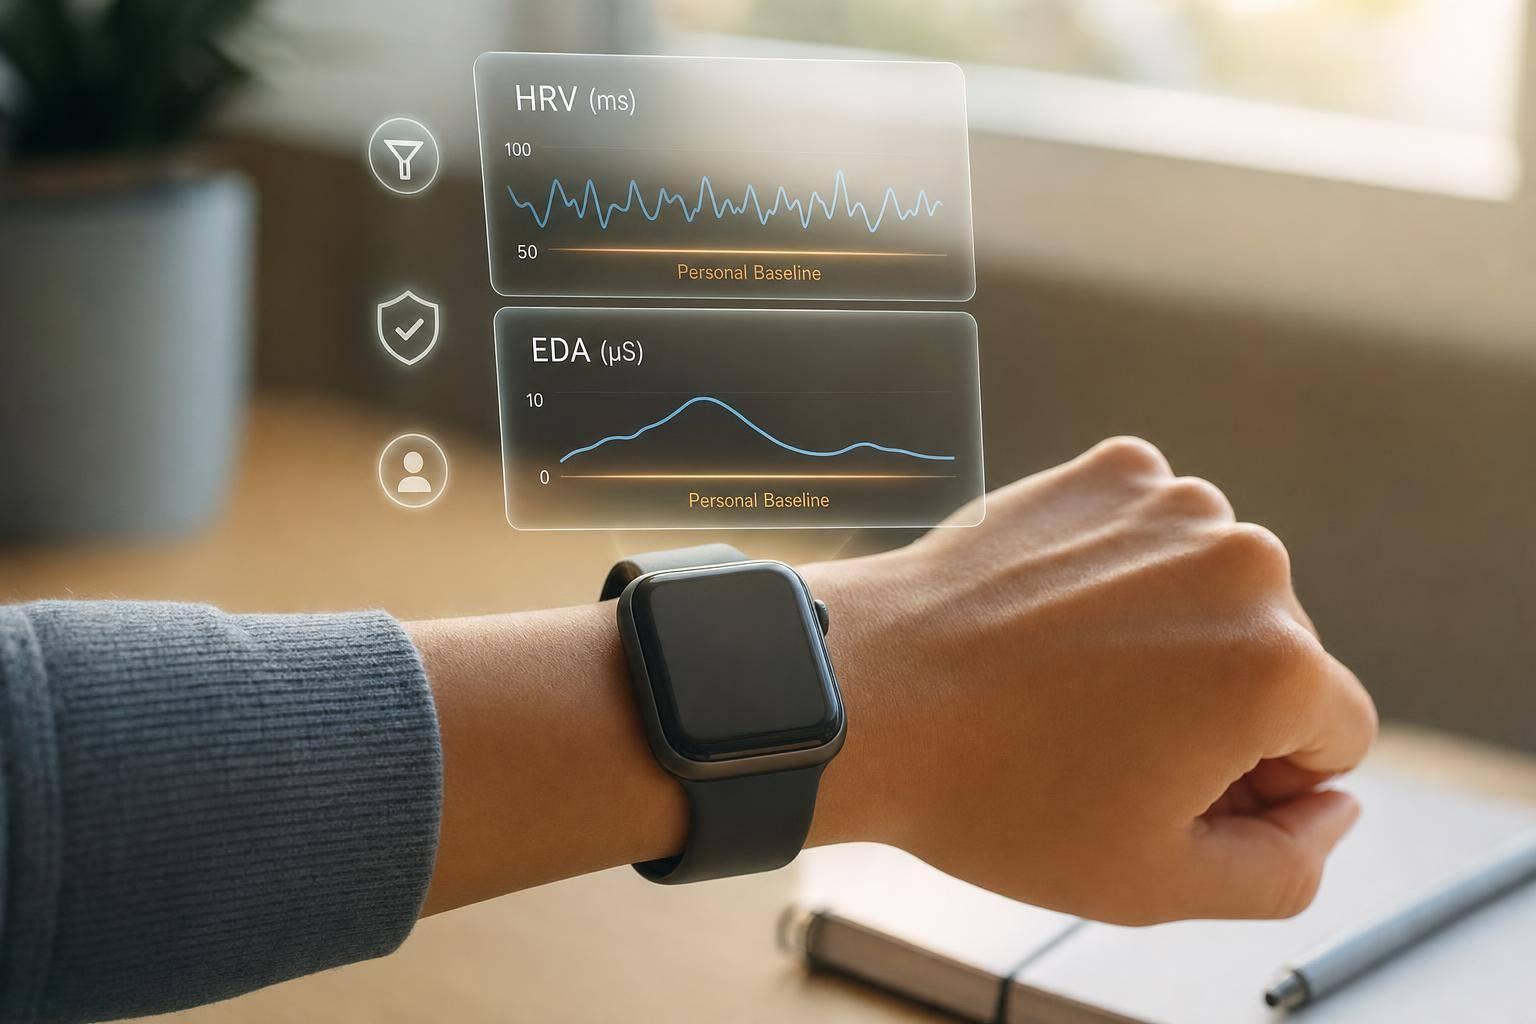
Most wearable stress errors start before the model. If I want better stress detection, I need to fix signal quality, feature choice, testing, and personal baselines first.
Here’s the short version:
- Clean data matters most. Wrist signals are easy to collect, but motion can distort them.
- HRV and EDA are core inputs. Stress often shows up as lower HRV and higher skin conductance.
- One sensor is often not enough. In the article, adding EDA to HRV improved AUROC from 0.776 to 0.984 in one study.
- Daily use is still hard. A 2024 meta-analysis reported 0.856 mean accuracy and 0.759 mean F1, which is not strong enough to trust without limits.
- Testing has to be clean. If the same users appear in training and testing, results can look better than they are.
- Personal baselines beat one-size-fits-all cutoffs. Resting EDA can range from 2 to 50 µS, so one reading can mean different things for different people.
- Deployment changes performance. On-device inference can cut latency from 76.5 ms in the cloud to about 9.8 ms at the edge.
If I boil the full article down to one idea, it’s this: better wearable stress detection comes from a clean pipeline, small high-signal feature sets, leak-free validation, and user-level calibration.
A quick side-by-side view:
| Area | What matters most | Main risk if ignored |
|---|---|---|
| Signal pipeline | Filtering, sync, segment quality | Noise gets mistaken for stress |
| Features | HRV + EDA + behavioral context | Weak or redundant inputs |
| Model testing | Subject-wise validation, F1, ROC-AUC | Inflated results |
| Deployment | Latency, battery, privacy | Slow alerts or more data exposure |
| Personalization | User baselines, day-to-day rhythm | Too many false alerts |
So if you want to improve a wearable stress system, I wouldn’t start with a fancier model. I’d start by making sure the device is reading the body cleanly, testing fairly, and learning what “normal” looks like for each person.
Stress Mindset Matters: Rethinking Mental Stress Detection with Multimodal Wearable Sensors
sbb-itb-f5765c6
Build a Strong Signal Pipeline First
A stress model is only as good as what you feed into it. If the input is noisy, out of sync, or sampled poorly, the model pays the price. So the biggest win often comes early: get clean, aligned data first. Then turn those raw streams into signals your model can trust.
Choose Sensors, Placement, and Sampling Settings Carefully
The sensor you choose affects everything that comes after it. Wrist PPG is easy to wear, but it’s sensitive to motion. Chest ECG is cleaner, but not ideal for all-day use. Ring PPG can help with contact stability, and wrist EDA adds detail about sympathetic arousal. There’s a tradeoff here, and it’s not small.
One study found that wrist PPG-derived pulse rate variability (PRV) had poor agreement with ECG-based HRV in 11 of 13 tested conditions[8]. That’s a pretty plain reminder: convenience often comes with lower signal fidelity.
Sampling rate and timestamp sync also matter more than people think. Heart-related signals need enough time resolution for solid peak detection. EDA can often run at a lower sampling rate. But once you start combining streams, even small timing offsets can throw off feature windows and damage labels. That’s why it helps to log the sensor clock, sampling rate, resampling steps, and interpolation choices. If timing is off, the rest of the pipeline can quietly drift off course too.
Remove Motion Noise and Low-Quality Segments
Motion artifacts are one of the biggest roadblocks in stress detection outside the lab[5][7]. In practice, no single filter fixes everything. It usually works better to combine a few methods.
Signal quality indices, or SQIs, can help you decide whether a PPG or ECG segment is usable before you extract features. Metrics such as kurtosis, skewness, entropy, and perfusion index are often used for this step[15]. If a segment is bad, it’s often safer to throw it out than to force a cleanup and hope for the best.
| Method | Use Case | Strengths | Limitations | Computational Cost |
|---|---|---|---|---|
| Band-pass filtering | PPG and ECG cardiac content | Isolates the heart-related frequency range; simple to implement | Can distort peaks if cutoffs are too narrow | Low |
| High-pass / detrending | Slow baseline drift | Removes slow drift without distorting cardiac content | May clip low-frequency stress responses if the cutoff is too high | Low |
| 60 Hz notch filter | Confirmed U.S. power-line interference | Removes narrow mains noise effectively | Can remove real physiological content if misapplied | Low |
| Accelerometer-based ANC | PPG during movement | Uses motion reference to cancel artifact directly | Requires synchronized accelerometer; adds pipeline complexity | Medium |
| Signal quality indexing (SQI) | PPG and ECG quality gating | Quantifies signal usability before feature extraction; improves generalizability | Rejects data, reducing coverage | Low–Medium |
| Segment rejection | Severe noise in any signal | Safest option when noise is unrecoverable | Reduces available data; needs careful threshold tuning | Low |
A common choice for PPG is a fourth-order Butterworth high-pass filter at 0.5 Hz to remove baseline wander[12][14]. That setup helps remove drift while keeping cardiac content down to about 40–45 beats per minute. For EDA, low-pass filtering at or below 5 Hz is often used to remove high-frequency noise before decomposition[3][6][11]. In the United States, a 60 Hz notch filter can help when power-line interference is confirmed, but if you use it in the wrong place, it can strip out real physiological signal[13].
Only after you remove bad segments should you extract HRV and EDA features.
Prepare HRV and EDA for Analysis
For HRV, start with peak detection. Then check inter-beat intervals and remove outliers, missed beats, duplicate peaks, and jumps that don’t make physiological sense. In one PPG validation study, a multi-scale peak detection algorithm reached an F1 score of 0.89 during sleep[4]. That shows what’s possible, but also how much room there still is for error. One missed beat can skew the whole interval series, and once that happens, the HRV features built on top of it can drift fast.
For EDA, separate the tonic and phasic components before feature extraction. The quality of that decomposition affects response count, amplitude, rise time, and area under the curve. Drift, missing samples, and contact artifacts need to be handled before decomposition, not later. Even when two teams use the same algorithm, different devices and sampling rates can lead to different outputs. So across a dataset, consistency matters just as much as the method.
With clean inputs in place, the next gains come from AI tools for cognitive stress recovery, feature selection, and model choice.
Extract Better Features and Train Models That Generalize
Use Stress-Relevant Features Across Multiple Signals
Once your signals are clean, the next step is figuring out which features actually carry stress information. For HRV in wearables, stick with features that reflect autonomic change: SDNN, RMSSD, pNN50, LF, HF, LF/HF - often used as a rough stress proxy - and a small set of nonlinear metrics such as SD1, SD2, and sample entropy.[24]
For EDA, useful features include phasic SCR rate, amplitude, rise time, recovery time, and tonic SCL. And this isn’t a small add-on. In multimodal models, EDA can shift results in a big way. One study found that AUROC went from 0.776 to 0.984 when EDA was added to an HRV-only model.[9]
Across studies, combining signals beats using just one signal. The smart move is to use the smallest multimodal feature set that still improves validation. To cut redundant features, use methods like mutual information, RFE, correlation filters, or mRMR.[16][17][18]
| Feature Type | Interpretability | Robustness | On-Device Feasibility |
|---|---|---|---|
| Handcrafted (HRV/EDA indices) | High - tied to known physiology | Good if engineered carefully; can degrade in new contexts | Excellent - computable in milliseconds on wearables |
| Learned (CNN/RNN/transformer embeddings) | Low to medium | Strong for in-distribution data; vulnerable to context shift without retraining | Variable - often requires quantization, pruning, or partial offloading |
Choose Models Based on Accuracy, Interpretability, and Device Limits
Feature quality only helps if the model can use those features well on the target device. After the feature set is locked in, pick the simplest model that still performs well across different users.
Random Forest, XGBoost, and SVM are often strong picks for feature-based stress classification. In one set of results, Random Forest reached 88.3% accuracy, 0.87 precision, 0.89 recall, and 0.88 F1, while SVM reached 85.3% accuracy with 0.85 F1 on a similar task.[10] These models fit well when you have engineered features and need lower-latency, simpler on-device inference on smartwatches and smartphones.
Deep models make more sense when you have larger and more diverse datasets, especially if you want to work from raw or lightly processed signals. CNNs are good at learning local temporal patterns across multichannel physiological data. Hybrid CNN-transformer setups can also do well on harder stress tasks. In one study, a multimodal deep learning model using accelerometer, EDA, heart rate, and skin temperature in nurses reached 91.0% accuracy with an F1-score of 0.91.[25] That said, full deep models can be tough to run straight on-device. Quantized on-device models can help cut latency because they avoid cloud transfer.
| Model | Strengths | Weaknesses | Deployment Fit |
|---|---|---|---|
| Random Forest | Robust to noisy features; built-in feature importance | Memory can grow with many trees; less suited to raw signals | Wearable/smartphone with engineered features |
| SVM | Strong on moderate feature sets; handles nonlinear boundaries well | Sensitive to kernel and parameter choices; scales poorly to very large datasets | Smartphone or some wearables |
| XGBoost | Strong performance; handles class imbalance well | Can overfit without regularization; memory use rises with many trees | Smartphone; on-device with modest tree counts |
| CNN | Captures local temporal and cross-channel patterns | Needs more data and compute; lower interpretability | Smartphone; quantized versions on higher-end wearables |
| RNN (LSTM/GRU) | Models long-range temporal dependencies | Training complexity; can overfit on small datasets | Smartphone or cloud |
| Transformer | Strong on large, diverse datasets; flexible attention | High data and compute requirements; hard to interpret | Cloud or server-side inference |
Train and Evaluate Without Data Leakage
Even a strong model falls apart if training and testing overlap. The biggest mistake here is letting the same person show up in both sets. When that happens, the model starts learning that person’s physiological patterns instead of stress patterns that hold up across people. The result? Accuracy can look better than it is. Subject-wise cross-validation, such as Leave-One-Subject-Out (LOSO), is the standard way to test how well the model generalizes across users.[23][20][22][21]
Class imbalance is another issue you can’t ignore. In day-to-day life, people are not stressed 50% of the time, so a weak model can still post decent-looking accuracy just by predicting not stressed too often. That’s why F1-score and ROC-AUC should be the main metrics when the classes are uneven. It also helps to review confusion matrices so you can see exactly where the model breaks down.
Deploy for Real-Time Use and Personalize Over Time
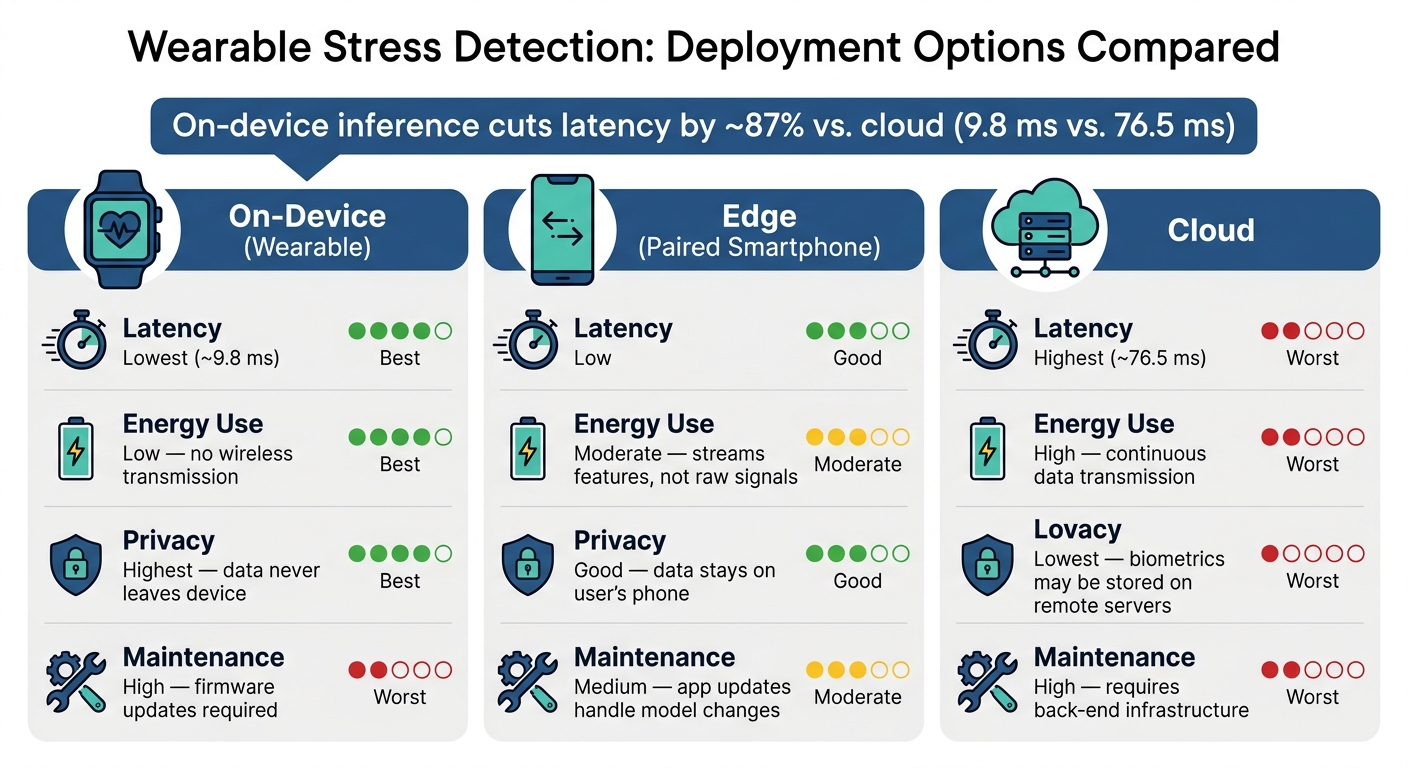
Wearable Stress Detection: Deployment Options Compared
Once the model passes validation, the next test is simple: does it hold up in daily life? Understanding how AI predicts stress from this data is the first step toward reliable real-world performance. That comes down to deployment and personalization. After validation, the next step is making the model work within device limits and privacy rules.
Balance On-Device Speed, Battery Life, and Privacy
Where the model runs shapes latency, battery drain, and privacy.
On-device inference keeps raw HRV and EDA data on the wearable and supports live feedback. One edge AI benchmark reported average latency of about 9.8 ms at the edge versus 76.5 ms in the cloud - about an 87% drop.[31][32] To make that work on a wearable, models usually need to stay small, often through 8-bit quantization and pruning, so they fit within tight power limits.[26] And because the earlier pipeline turns raw signals into more stable features, local inference needs less compute.
Cloud inference comes with more latency, more data exposure, and a hard reliance on network uptime. Sensitive biometric data also leaves the device, which adds privacy and legal risk - especially in the U.S., where state privacy laws and HIPAA concerns may come into play for health data.[29]
Phone-based inference sits between those two options. In this setup, the wearable sends preprocessed features to the user's phone, and the phone runs the classifier. That keeps data off remote servers and makes model updates easier through app releases.
| Deployment | Latency | Energy Use | Privacy | Maintenance Complexity |
|---|---|---|---|---|
| On-device (wearable) | Lowest | Low - no wireless transmission | Highest - data never leaves device | High - requires firmware updates and tight model optimization |
| Edge (paired smartphone) | Low | Moderate - streams features, not raw signals | Good - data stays on the user's phone | Medium - app updates handle model changes |
| Cloud | Highest | High - continuous data transmission | Lowest - biometrics may be stored on remote servers | High - requires back-end infrastructure, uptime, and monitoring |
Personalize Baselines to the Individual User
Even if inference runs well, the model still needs user-specific baselines to stay accurate. Stress baselines vary a lot from person to person, so global thresholds tend to miss the mark.
Resting HRV metrics such as RMSSD and SDNN can differ a lot across users because of age, fitness, genetics, and medication use.[28][19] EDA varies even more. Skin conductance level at rest can range from 2 to 50 µS across individuals, while response amplitudes can span 0.1 to 17 µS.[34][35] So the exact same reading might point to stress for one person and look normal for someone else.
A more useful approach is person-specific normalization. For example, z-scoring HRV features per user instead of across the whole population helps cut inter-person noise and makes the model steadier.[20] It also helps fix cross-user variance that subject-wise validation can't remove once the system is out in the wild. HR and HRV also shift across the day, so changes from that person's own daily rhythm tell you more than raw values alone when you're trying to detect stress.[36]
Building a solid personal baseline usually takes several days to a few weeks of data across workdays, weekends, and sleep, plus activity context so the system can tell stress-related HR changes from exercise-related ones.[30][2][1] In practice, the best setup often mixes a few methods: start with a static baseline, update it over time, and use occasional user-confirmed labels to keep the model from drifting.[27][6][2]
| Personalization Method | Setup Effort | Responsiveness | Stability | Best Use Case |
|---|---|---|---|---|
| Static calibration period | Medium - requires a few low-stress days upfront | Low - baselines update slowly | High | Users with stable daily routines |
| Continuous online adaptation | Low - runs passively | High - captures gradual fitness or chronic stress changes | Medium - risk of drift if stress becomes the new baseline | Long-term daily wear |
| Cluster-based personalization | Low for users - handled by the system | Medium | Medium-high | Large-scale deployments with minimal user input |
| User-in-the-loop labeling | Moderate - occasional self-report prompts | High - improves specificity over time | High with regular input | Motivated users; higher-stakes health contexts |
Turn Stress Detection Into Actionable Guidance
The last piece is turning detections into advice a person can actually use.
A sustained shift in HRV and EDA, by itself, doesn't tell someone what action to take. But when you pair that signal with sleep data, activity context, and time of day, it can support advice that feels timely instead of generic.
Context changes everything. A stress signal during a long, sedentary work stretch calls for one kind of prompt. Elevated heart rate during a run means something else entirely. Models that use activity context along with physiology show better accuracy and lower variance than physiology-only systems, and automatic activity estimation from accelerometer data works better than depending on user-reported context.[33]
The same logic applies to sleep. If stress spikes line up with short or broken sleep, sleep-focused advice makes more sense - earlier wind-down routines and other sleep-hygiene steps - instead of tossing out a generic breathing prompt.
The point is to move from stress detection to guidance that matches the moment, not just hand the user a score.
Conclusion: The Techniques That Improve Stress Detection Most
Better stress detection starts with clean data, not a flashy model. If the signal is noisy or sampled poorly, the system ends up learning artifacts instead of stress.
Once the signal pipeline is in good shape, feature design starts to matter more. In many cases, multimodal features beat single-sensor inputs because they give the model more than one clue to work with. And evaluation has to be leak-free. If it isn't, test data can make results look better than they are.
Even a strong model can fall apart on the device itself. It still has to work within battery, latency, and privacy limits. That part often decides whether a system is usable in daily life or just looks good in a lab setting.
After deployment, personalization is what keeps alerts useful over time. Personal HRV baselines tend to work better than one-size-fits-all cutoffs, and context helps separate actual stress from other states that look similar. The best systems don't just detect stress. They help support the right response.
FAQs
How much baseline data do I need?
Most systems need 2 to 4 weeks of steady data to build a stress baseline you can trust. During that setup window, they track your usual patterns, like resting heart rate, heart rate variability, sleep, and daily activity.
Some methods begin with 14 days of data. But in many cases, a full month gives the algorithm a better personal reference point, which helps it tell the difference between normal day-to-day shifts and changes linked to stress.
Can a smartwatch detect stress accurately enough?
Yes. Modern smartwatches can detect stress with high accuracy. In some cases, results reach up to 98.6%, especially when the watch uses AI and pulls data from more than one sensor.
Here’s why that matters: stress doesn’t show up in just one signal. A watch that tracks heart rate, electrodermal activity, skin temperature, and movement at the same time can give a more dependable read than a device that relies on just one of those inputs.
For the best read, wear the device snugly and on a regular basis. That helps it learn your normal patterns and build a personal baseline, which makes stress detection more accurate over time.
Which metric matters most beyond accuracy?
Beyond raw accuracy, the biggest factor is keeping a personalized baseline. Signals like heart rate variability (HRV) and skin temperature can differ a lot from one person to the next, so a one-size-fits-all cutoff can easily misread what's going on.
That’s why systems that learn your patterns over time - like your resting heart rate or usual sleep duration - tend to give more dependable insights and stress guidance you can actually use.